
ChartSmith
Paste a spreadsheet, get a chart you can restyle like any other layer. Free to install; Pro is $4.99/month.
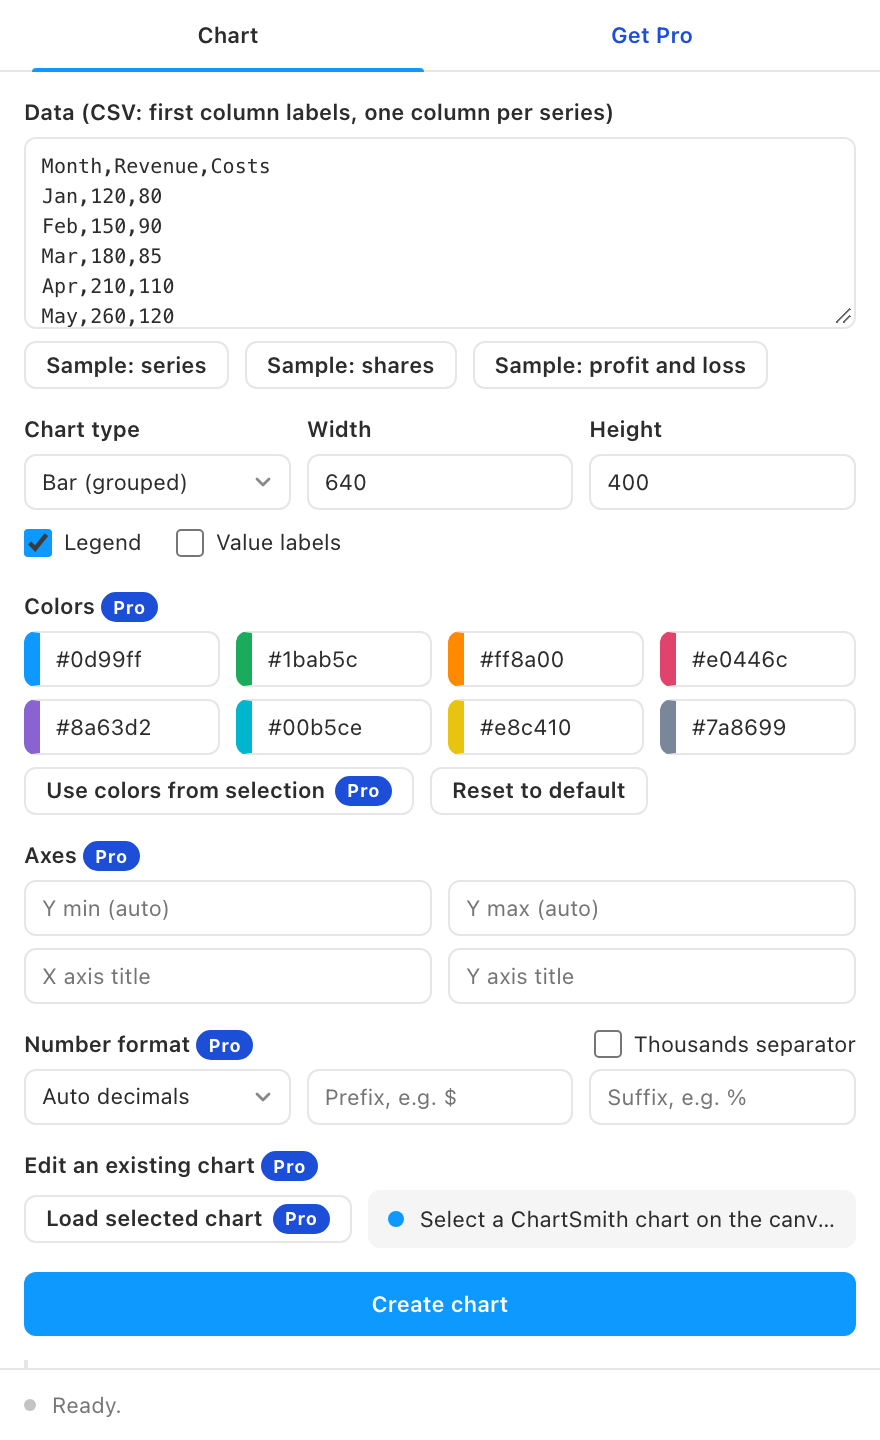
Chart screenshots go stale and chart libraries do not live on a canvas. ChartSmith draws bar, line, area, pie, and donut charts as native Figma vectors from pasted data.
Free vs Pro
- Name
Free, forever- Type
- no account needed
- Description
Grouped bar, stacked bar, horizontal bar, line, area, pie and donut charts, negative values, legends, value labels and sample data, at any size, as native editable layers.
- Name
Pro- Type
- $4.99/month
- Description
A custom palette or colors from your selection, editing an existing chart in place, axis minimum, maximum and titles, and number formatting.
Every chart type is free; the controls that make charts match a brand and stay editable are Pro. Buy from the plugin's Get Pro tab, paste the license key that arrives by email, and the locked features unlock on up to 3 devices. See Pricing for how subscriptions, devices and cancelling work.
What it does
- Seven chart types. Grouped bars, stacked bars, horizontal bars, line, area, pie and donut, all free, with negative values.
- Paste from any spreadsheet. Comma or tab separated; first column is labels, each further column is a series.
- Everything is a layer. Bars are rectangles, lines are vectors, labels are text. Restyle or reuse parts freely.
- Sensible axes. Nice-number scales, gridlines, and tick labels computed for you.
- Legends and value labels. Numbers on bars and points, percentages on pie slices.
- Brand colors and editing (Pro). Eight custom colors or colors taken from your selection, edit an existing chart with new data, axis limits and titles, number formatting.
How to use it
- Shape the data. Header row first: Label, Series A, Series B. One row per category, numbers in value cells.
- Pick a type and size. Pie and donut read the first series; cartesian types plot every series.
- Create and restyle. The chart lands as a frame of ordinary layers, selected and zoomed. Change any fill or font like normal.
Guides
- Quickstart: install and get your first result in two minutes.
- Feature guide: every control explained, and the rules the plugin follows.
- Pro features: what Pro unlocks and how the gate works.
- Troubleshooting: what to check when a result looks wrong.
Install
Figma desktop app
> Plugins > Development > Import plugin from manifest...
> select chart-smith/manifest.json
FAQ
Can it read Google Sheets directly?
Copy the range in Sheets and paste; tab-separated input parses natively. Live links would require network access to Google, which this plugin does not have: the only domain it can reach is the license check.
Can I update a chart with new data?
Charts are plain layers with no hidden state. Create a fresh one from the new data and swap it in.