
ChartSmith quickstart
Paste a table, pick a type, click Create. Every chart type is free.
ChartSmith needs a Figma design file. It builds charts from vector layers, which FigJam boards cannot hold, so it does not appear in FigJam.
Install the plugin
- Open ChartSmith on the Figma Community and click Install.
- Open a Figma design file.
- Run it from Plugins → ChartSmith, or press Cmd/Ctrl + / and type "ChartSmith".
Your first chart
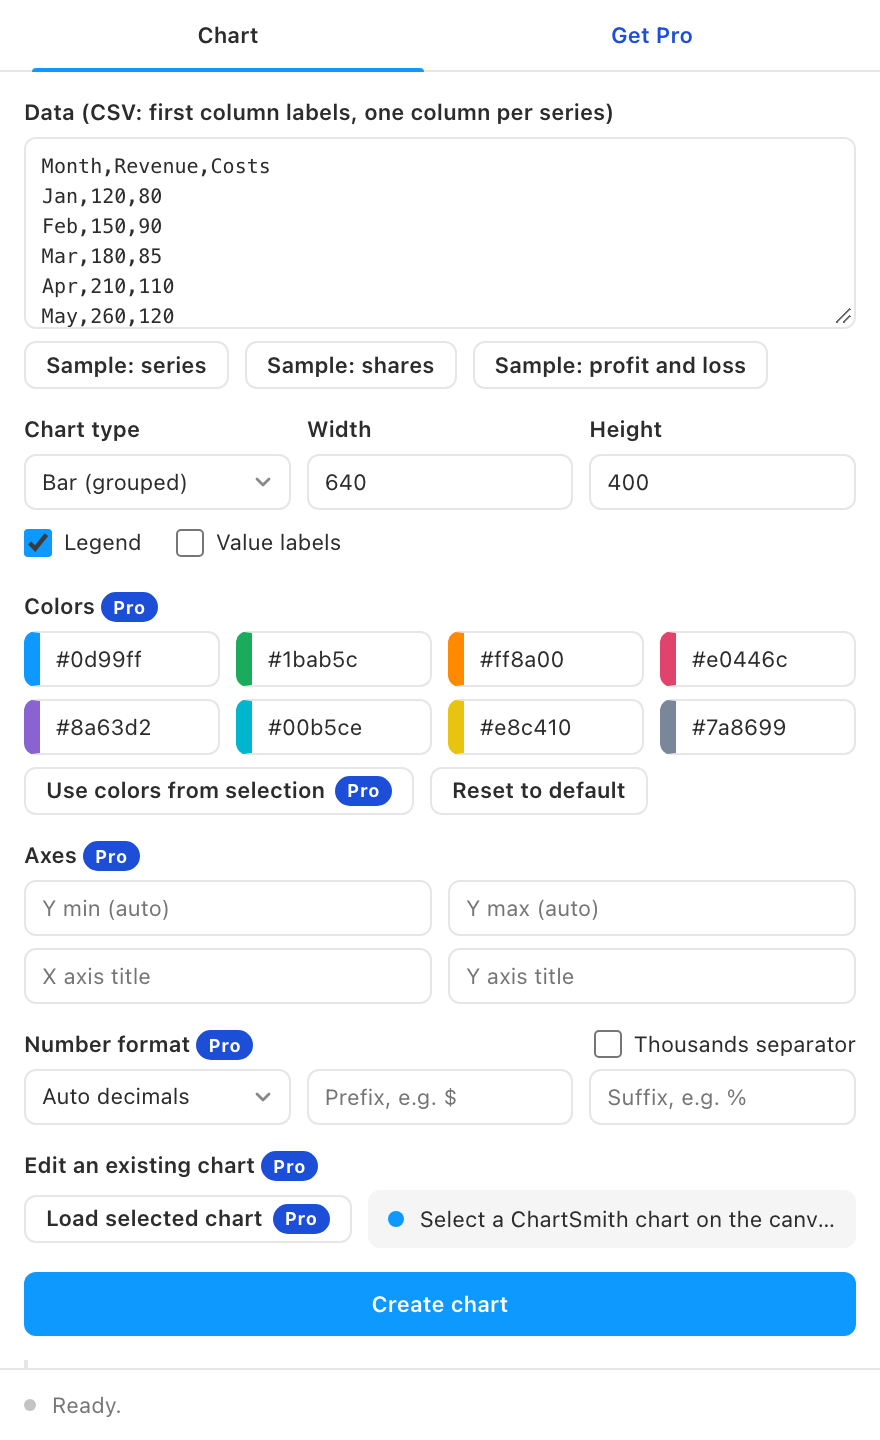
- Paste your data into the Data box. The first row is the header, the first column holds the category labels, and every further column is a series. Comma or tab separated both work, so copy straight from a spreadsheet. The three sample buttons load example data.
- Pick a chart type: grouped bar, stacked bar, horizontal bar, line, area, pie or donut. Pie and donut use the first series.
- Set the size in pixels and tick Legend and Value labels as needed.
- Click Create chart.
The chart lands as a frame in the middle of your viewport, selected and zoomed to. Bars are rectangles, lines are vectors, labels are text, so restyle anything like any other layer.